

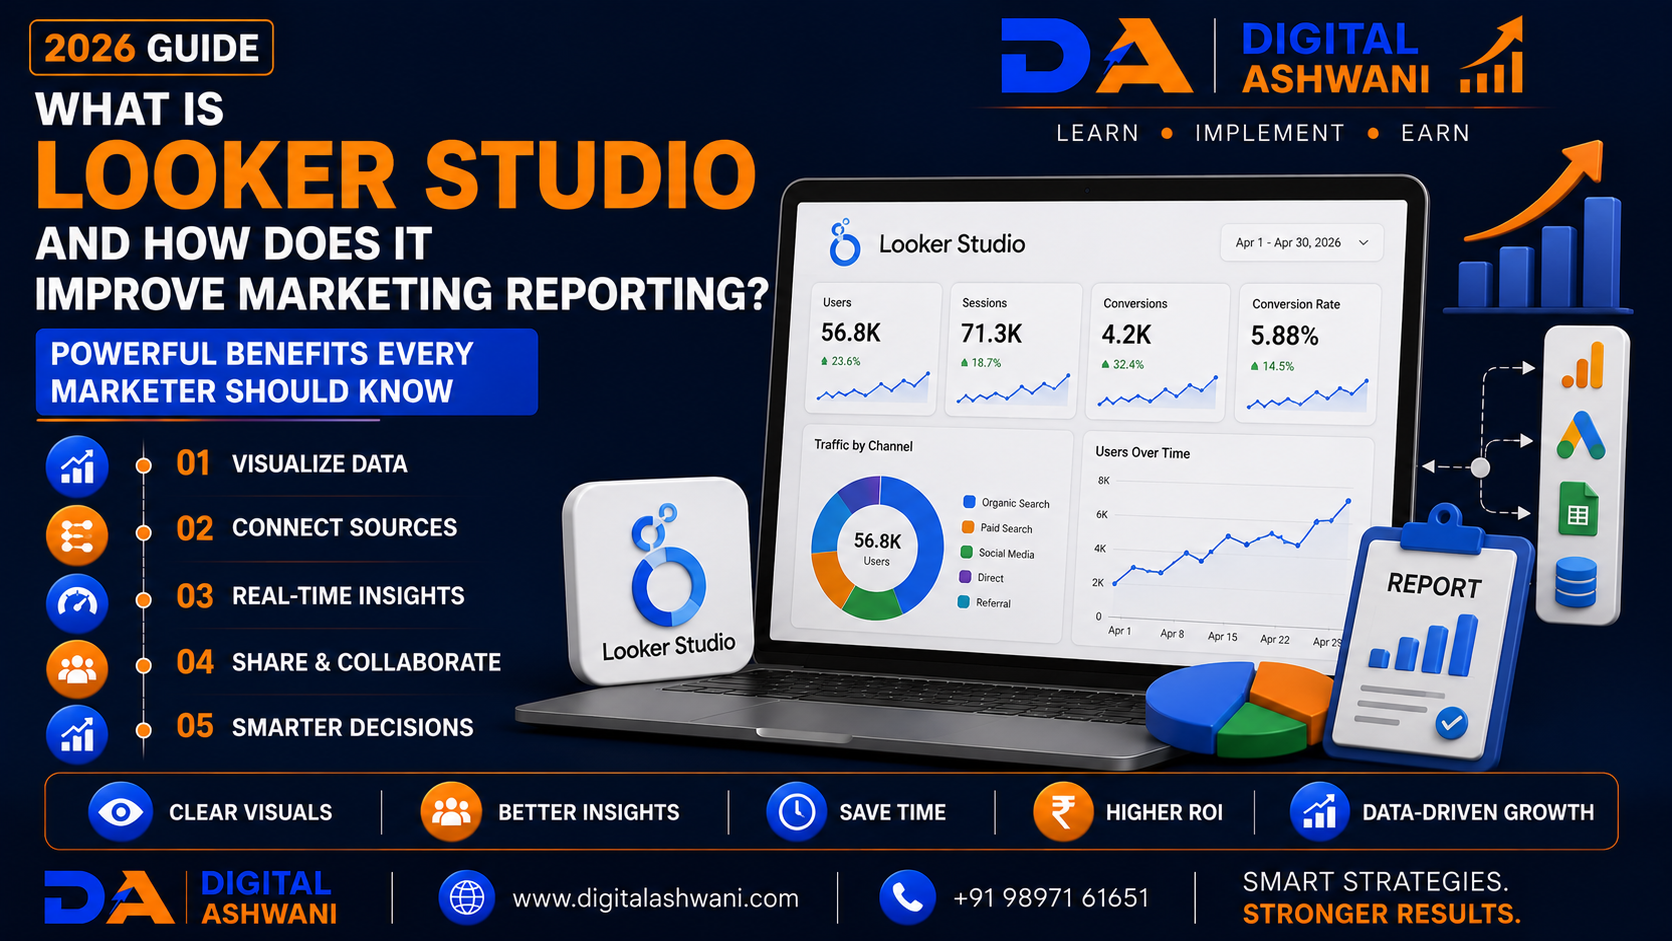
What Is Looker Studio and How Does It Improve Marketing Reporting?
Modern digital marketing generates data from multiple platforms, including Google Analytics 4, Google Ads, Search Console, Meta Ads, YouTube, CRM systems, and eCommerce platforms. While this data is valuable, managing it across multiple dashboards can quickly become overwhelming.
This is where Looker Studio becomes an essential tool.
Formerly known as Google Data Studio, Looker Studio is Google’s free business intelligence and reporting platform that transforms raw marketing data into interactive dashboards and visual reports. Instead of checking several platforms individually, marketers can view important metrics in one centralized dashboard.
Whether you’re a digital marketer, SEO professional, PPC specialist, business owner, agency, or eCommerce manager, Looker Studio helps simplify reporting, automate performance tracking, and improve decision-making.
In this comprehensive guide by Digital Ashwani, you’ll learn 15 powerful ways Looker Studio improves marketing reporting, helping businesses save time, monitor campaigns efficiently, and make better data-driven decisions in 2026.
What Is Looker Studio?
Looker Studio is a cloud-based reporting and data visualization platform that allows users to build customizable dashboards using data from multiple sources.
It supports reporting from platforms such as:
- Google Analytics 4
- Google Ads
- Google Search Console
- YouTube Analytics
- Google Sheets
- BigQuery
- SQL Databases
- Third-Party Connectors
Instead of manually preparing spreadsheets, marketers can create automated dashboards that update automatically.
Why Marketing Reporting Matters
Accurate reporting helps businesses understand:
- Website Performance
- Campaign Results
- Customer Behavior
- Advertising ROI
- SEO Growth
- Lead Generation
- Conversion Trends
- Revenue Performance
Without proper reporting, it becomes difficult to identify what’s working and where improvements are needed.
Benefits of Looker Studio
An effective reporting system helps businesses:
- Save Time
- Automate Reports
- Improve Data Visualization
- Monitor KPIs
- Improve Collaboration
- Make Faster Decisions
- Increase Marketing Efficiency
- Support Business Growth
15 Powerful Looker Studio Features
1. Create Interactive Dashboards
Instead of static spreadsheets, Looker Studio allows you to build interactive dashboards.
Include:
- Charts
- Tables
- Scorecards
- Maps
- Graphs
- Filters
Interactive dashboards make reports easier to understand.
2. Connect Multiple Data Sources
One dashboard can combine data from multiple platforms.
Examples include:
- Google Analytics 4
- Google Ads
- Search Console
- Google Sheets
- CRM Systems
- YouTube Analytics
This provides a complete view of marketing performance.
3. Automate Marketing Reports
Instead of preparing reports manually every week or month, Looker Studio automatically updates connected dashboards as new data becomes available.
Automation reduces repetitive work while improving reporting accuracy.
4. Visualize Data Clearly
Looker Studio offers visual elements such as:
- Line Charts
- Bar Charts
- Pie Charts
- Tables
- Geographic Maps
- Time Series Graphs
Clear visualization helps stakeholders understand performance quickly.
5. Share Reports Easily
Reports can be securely shared with:
- Clients
- Team Members
- Managers
- Business Owners
Permissions help control who can view or edit dashboards.
6. Monitor Marketing KPIs
Track key metrics such as:
- Organic Traffic
- Conversions
- Click-Through Rate (CTR)
- Cost Per Click (CPC)
- Return on Ad Spend (ROAS)
- Leads
- Revenue
Monitoring KPIs supports better campaign optimization.
7. Customize Dashboards
Create dashboards tailored for different audiences.
Examples:
- SEO Dashboard
- Google Ads Dashboard
- Executive Dashboard
- eCommerce Dashboard
- Lead Generation Dashboard
Custom reports improve clarity and decision-making.
8. Improve Collaboration
Marketing teams can work together using shared dashboards.
Everyone views the same live data, reducing reporting inconsistencies and improving communication.
9. Track Performance in Real Time
Looker Studio automatically refreshes connected data sources, allowing marketers to monitor campaign performance without manually updating spreadsheets.
Real-time monitoring helps you:
- Identify Traffic Changes
- Monitor Active Campaigns
- Detect Performance Issues
- Measure Lead Generation
- Review Conversion Trends
- React More Quickly
Timely insights support faster and more informed marketing decisions.
10. Build Executive-Level Dashboards
Business owners and managers often need high-level performance summaries rather than detailed technical reports.
Create executive dashboards that display:
- Total Website Users
- Leads Generated
- Revenue
- Conversion Rate
- Marketing ROI
- Advertising Spend
- Top Traffic Sources
- Overall Business Growth
Simple dashboards help decision-makers understand performance at a glance.
11. Use AI to Analyze Marketing Data
Artificial Intelligence can complement Looker Studio by helping marketers interpret complex reports.
AI can assist with:
- Trend Analysis
- Data Summaries
- Performance Insights
- Campaign Recommendations
- Forecast Discussions
- Content Performance Reviews
Always validate AI-generated interpretations against your actual business data before making strategic decisions.
12. Schedule and Share Automated Reports
Instead of exporting reports manually, you can schedule report delivery or share live dashboards with stakeholders.
This helps:
- Reduce Manual Reporting
- Improve Team Communication
- Keep Clients Updated
- Increase Reporting Efficiency
- Ensure Everyone Uses Current Data
Automated reporting saves time while improving consistency.
13. Monitor SEO Performance
Looker Studio works particularly well for SEO reporting.
Create dashboards that monitor:
- Organic Traffic
- Keyword Performance
- Clicks
- Impressions
- Average Position
- Indexed Pages
- Landing Pages
- Search Console Metrics
SEO dashboards help identify opportunities for continuous optimization.
14. Measure Advertising Performance
Combine advertising data into one dashboard.
Track:
- Google Ads
- Meta Ads
- Campaign Spend
- Cost Per Click (CPC)
- Cost Per Lead (CPL)
- Conversion Rate
- Return on Ad Spend (ROAS)
Unified reporting makes it easier to compare channel performance.
15. Continuously Improve Your Dashboards
Marketing priorities change over time.
Regularly review and update your dashboards by:
- Adding New KPIs
- Removing Unused Charts
- Improving Filters
- Simplifying Layouts
- Updating Data Sources
- Refining Visualizations
Well-maintained dashboards remain useful as your business grows.
Looker Studio Dashboard Checklist
Before publishing your dashboard, ensure you’ve completed the following:
- Data Sources Connected
- KPIs Selected
- Charts Configured
- Filters Added
- Branding Applied
- Date Controls Enabled
- Calculated Fields Verified
- Dashboard Tested
- Sharing Permissions Reviewed
- Monthly Dashboard Review Scheduled
Following this checklist helps create accurate, easy-to-understand marketing reports.
Common Looker Studio Reporting Mistakes
Tracking Too Many Metrics
Avoid overwhelming dashboards with unnecessary information.
Focus on KPIs that directly support your business objectives.
Using Confusing Visualizations
Choose charts that clearly communicate insights.
Simple visualizations are usually easier for stakeholders to interpret.
Ignoring Data Accuracy
Regularly verify that connected data sources are working correctly and displaying current information.
Not Segmenting Reports
Create separate dashboards for SEO, PPC, Social Media, eCommerce, and executive reporting instead of combining everything into one report.
Never Updating Dashboards
As campaigns, business goals, and marketing channels evolve, dashboards should be reviewed and updated to remain relevant.
Internal Linking Suggestions (Digital Ashwani)
Strengthen your analytics and reporting content cluster by linking this article with:
- What Is Google Analytics 4 and Why Every Business Should Use It?
- How to Create Custom Events in Google Analytics 4 Without Coding
- Ultimate Analytics and Tracking Guide for Long-Term Business Growth
- Complete Google Search Ads Campaign Setup Guide for Better Lead Generation
- Complete Google Display Ads Guide for Brand Awareness and Remarketing
- What Is First-Party Data? Why It Matters for Modern Marketing
- How to Increase Website Conversion Rates Using Data-Driven Optimization Methods
- What Is Artificial Intelligence (AI) in Digital Marketing?
- AI SEO: How Artificial Intelligence Can Improve Your Search Engine Rankings
- What Are Negative Keywords?
These internal links strengthen topical authority while helping readers explore related analytics, reporting, SEO, Google Ads, AI, and conversion optimization topics.
External Resources
For trusted Looker Studio guidance, explore:
- Looker Studio Help
- Google Analytics Help Center
- Google Search Console Help
- Google Ads Help Center
- Google Cloud Documentation
These official resources provide the latest documentation, tutorials, and best practices for reporting, dashboard creation, and data visualization.
Frequently Asked Questions
What is Looker Studio used for?
Looker Studio is a business intelligence and reporting platform that helps users create interactive dashboards by combining data from multiple marketing and analytics sources.
Is Looker Studio free?
Yes. Looker Studio is available at no cost and supports reporting for many Google products and other compatible data sources.
Can Looker Studio connect to Google Analytics 4?
Yes. Looker Studio integrates directly with Google Analytics 4, allowing you to visualize website traffic, user behavior, conversions, and other important metrics.
Who should use Looker Studio?
Digital marketers, SEO professionals, PPC specialists, agencies, business owners, eCommerce managers, and analysts can all benefit from using Looker Studio for marketing reporting.
How does Looker Studio improve marketing reporting?
It centralizes data from multiple platforms, automates dashboard updates, simplifies visualization, improves collaboration, and helps marketers make better data-driven decisions.
Final Thoughts
Understanding What Is Looker Studio and How Does It Improve Marketing Reporting is essential for businesses that want to simplify reporting and make better marketing decisions. Instead of switching between multiple platforms, Looker Studio brings important performance data together into one interactive dashboard, making trends easier to identify and communicate.
By combining Google Analytics 4, Google Ads, Search Console, YouTube Analytics, CRM systems, and other marketing data sources into customized dashboards, businesses can reduce manual reporting, improve collaboration, and monitor key performance indicators more efficiently.
As digital marketing continues to become increasingly data-driven, organizations that invest in clear reporting, reliable dashboards, and continuous performance analysis will be better positioned to optimize campaigns, improve ROI, and achieve sustainable long-term growth.
At Digital Ashwani, we regularly publish practical guides on Google Analytics, Looker Studio, SEO, Google Ads, AI Marketing, Conversion Optimization, and Digital Marketing to help businesses turn marketing data into actionable business insights.
